Kaya-chan, I heard on the news the other day that the world population will reach 9.7 billion by 2050. How is population prediction done?
Kaya
Well, population prediction is quite a complex issue, so let's start by thinking about it using the classical Malthusian model.
Malthusian Growth Model
The British economist Thomas Robert Malthus presented his ideas on population prediction in his 1798 publication An Essay on the Principle of Population.
Thomas Robert Malthus
In modeling population prediction, he assumed that both the number of births and deaths in a short time interval \( \Delta t \) are proportional to the population \( N \) and the time interval \( \Delta t \).
\[ \begin{align}
&\text{Number of births} = \alpha N \Delta t, \\\\
&\text{Number of deaths} = \beta N \Delta t \quad (\alpha, \beta \text{ are constants}) \cdots (1)
\end{align}\]
Note 1: \( \Delta \) (Delta) is an uppercase Greek letter. This symbol is often used to represent a "range" or "interval." Specifically, using two different times, \( t_1 \) and \( t_2 \), it can be expressed as:
\[ \Delta t = t_2 - t_1\]
Note 2: Time is often represented by \( t \), which comes from the English word time. Similarly, when representing a number, \( N \) is commonly used, which derives from the English word Number.
\( \alpha \) and \( \beta \) are constants known as the birth rate and death rate, respectively (values that do not change even as time \( t \) changes). Although actual birth and death rates are influenced by factors like a country’s economic conditions or social welfare systems, in the Malthusian model, they are simplified and treated as constants.
Nayumi
What did 'proportionality' mean again?
Kaya
I'd like you to at least understand proportionality, Nayu-nee.
\[ \text{Proportion}\]
When a variable \( y \) is a function of a variable \( x \) and can be expressed using a certain constant \( a \neq 0 \) as \( y = ax \), \( y \) is said to be proportional to \( x \). The constant \( a \) is called the proportionality constant or the rate of change.
Note 1: When a letter or symbol is treated as something that can change in value, it is called a variable.
Note 2: In multiplication between symbols or between a symbol and a number, the \( \times \) sign is often omitted.
Note 3: A function is a relationship where the value of one variable is uniquely determined by the values of other variables, constants, and numbers.
Nayumi
It's hard to visualize when there are only symbols.
Kaya
In that case, you should try substituting values into the symbols.
For example, if we set \( \alpha = 0.1 \) [/day], \( N = 100 \) [people], and \( \Delta t = 1 \) [day], then the number of births is:
\[ 0.1 \times 100 \times 1 = 10 \text{ [people]}\]
Here, [/~] represents a unit per ~. In this case, it means that in a village with a population of 100 people, after 1 day, \( 0.1 \times 100 = 10 \) people are born.
Kaya
Next, let's consider how much the population increases within the time interval \( \Delta t \).
If we define the population increase within the time interval \( \Delta t \) as \( \Delta N \), then:
\[ \begin{align}
\Delta N &= (\text{Number of births}) - (\text{Number of deaths}) \\\\
&= \alpha N \Delta t - \beta N \Delta t \\\\
&= (\alpha - \beta) N \Delta t \quad \cdots (2)
\end{align}\]
The last transformation is called the distributive law, which in simpler terms is often described as "factoring out" or "grouping with parentheses."
Next, let's divide both sides of this equation by \( \Delta t \).
\( \Delta N / \Delta t \) represents the rate of population change.
This calculation is similar to finding speed using the speed formula in physics.
Here, the "change in population" corresponds to "distance" in the speed formula.
Nayumi
We can determine the rate of population change using equation \( (3) \), right?
Kaya
Well, that's true, but what we're aiming for isn't just the rate of population change we calculated earlier.
In equation \( (3) \), what we calculated was the average rate of population change over the time interval \( \Delta t \). However, what we actually want to find is the instantaneous rate of population change.
The instantaneous rate can be thought of as the average rate over a time interval that is infinitely close to zero. Mathematically, this corresponds to taking the limit.
We express the operation of making the time interval \( \Delta t \) approach zero as \( \lim_{\Delta t \to 0} \). The ratio of the population change \( \Delta N \) to the time interval \( \Delta t \), when taking this limit, is written as \( \frac{dN}{dt} \).
Thus, the instantaneous rate of population change can be expressed as follows.
\[ \lim_{\Delta t \to 0} \frac{\Delta N}{\Delta t} = \frac{dN}{dt} = (\alpha - \beta) N \cdots (4) \]
An equation like equation \( (4) \), which contains the derivative of an unknown function (in this case, \( N \)), is called a differential equation.
Based on this differential equation, we can predict population changes using various methods.
There are several approaches to solving it, but this time, we will use the separation of variables method.
\[ \text{Solving by the Separation of Variables Method}\]
\[ \begin{align}
\frac{dN}{dt} &= (\alpha - \beta) N \\\\
\frac{1}{N} \frac{dN}{dt} &= ( \alpha - \beta ) \\\\
\int \frac{1}{N} \frac{dN}{dt} dt &= \int ( \alpha - \beta ) dt \\\\
\int \frac{1}{N} dN &= \int ( \alpha - \beta ) dt \\\\
\ln N &= ( \alpha - \beta ) t + C
\end{align}\]
When \( t = 0 \), we are given that \( N = N_0 \).
In this case, we obtain \( C = \ln N_0 \), therefore,
\[ \begin{align}
\ln N &= ( \alpha - \beta ) t + \ln N_0 \\\\
\ln N - \ln N_0 &= ( \alpha - \beta ) t \\\\
\ln \frac{N}{N_0} &= ( \alpha - \beta ) t \\\\
\frac{N}{N_0} &= e^{( \alpha - \beta ) t} \\\\
N &= N_0 e^{( \alpha - \beta ) t}
\end{align}\]
The first half involves moving the terms with \( N \) to the left-hand side and the other terms to the right-hand side (variable separation), followed by taking the indefinite integral on both sides.
In the second half, the initial condition \( (t, N) = (0, N_0) \) is used to determine the integration constant \( C \), leading to the particular solution of the differential equation:
\[ N = N_0 e^{(\alpha - \beta) t}\]
Kaya
This is the tool that allows you to calculate population changes using the obtained particular solution.
Try experimenting by changing the values of \( N_0 \), \( \alpha \), and \( \beta \). Also, modify \( T \), which represents the time range for the calculation, to see how it affects the results.
Green Line
Blue Line
Nayumi
Wow, amazing! Did Kaya-chan make this?
Kaya
Yes! Oh, and make sure to enter the values of \( N_0 \), \( \alpha \), \( \beta \), and \( T \) within the specified range in parentheses.
Nayumi
What happens if it goes beyond this range?
Kaya
Depending on the situation, the program may stop working.
If the page freezes, please reload the browser.
Nayumi
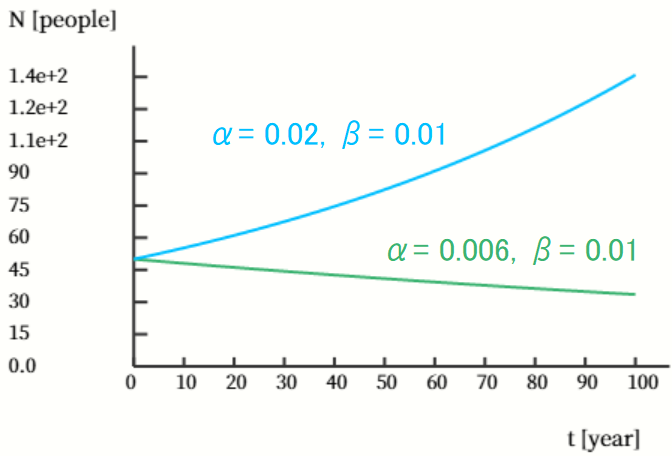
For now, I clicked the 'Draw' button without thinking, and two lines appeared on the graph.
The notation \( e + n \) on the vertical axis of the graph represents \( \times 10^n \), which is called scientific notation or "E notation." This is commonly used in computer-based exponential notation.
The green line slopes downward, while the blue line slopes upward. This difference is due to the positive or negative sign of the difference between the birth rate and death rate, \( \alpha - \beta \):
\[ \begin{align}
& \alpha - \beta \lt 0 \quad \text{means downward slope} \\\\
& \alpha - \beta \gt 0 \quad \text{means upward slope}
\end{align}\]
Kaya
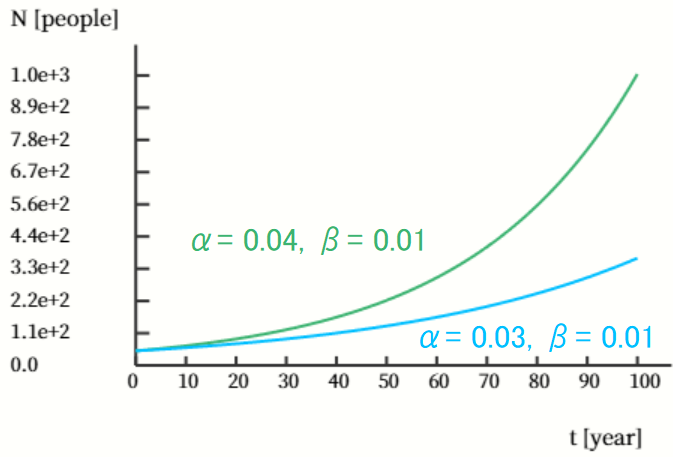
There’s also this pattern.
In this case, the values of the death rate \( \beta \) are the same for both graphs. Therefore, the difference in the graphs is due to the birth rate \( \alpha \), with the green line, which has a higher birth rate, showing a steeper slope.
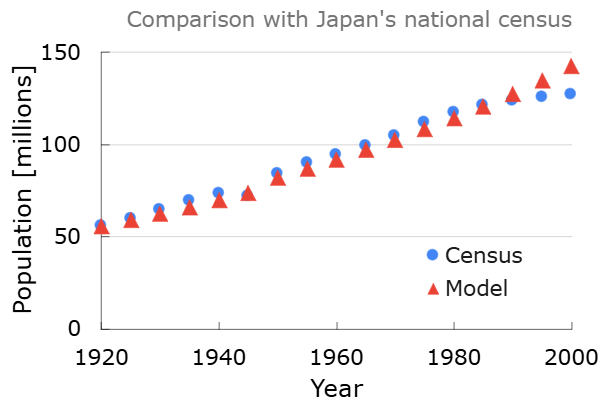
Comparison with Japan's national census
Nayumi
By the way, I wonder if the Malthusian model can accurately represent actual population changes.
Kaya
In that case, there is a graph comparing the results of Japan's national census with the calculated values from the Malthusian model.
Note: The results of Japan's census from 1920 to 2000, taken every five years, are used.
The parameters for the Malthusian model are \( \alpha = 0.061 \), \( \beta = 0.05 \), and \( N_0 = 55963053 \). Additionally, 1920 is set as \( t = 0 \).
Looking at the graph, it can be seen that until 1990, the results of Japan's census are well represented by the Malthusian model. However, in 1995 and 2000, the Malthusian model slightly overestimates the population. Since the Malthusian model assumes continuous population growth once it starts, it has the limitation of being unable to represent changes like the shift from population growth to decline, as seen in present-day Japan.
Moreover, it is fundamentally difficult to represent the various cultural and social factors that influence population growth and decline neatly with a mathematical formula. For example, in Japan, there was a significant decline in the birth rate in 1966, which is said to be because it was the "hinoeuma" year. "Hinoeuma" is one of the ganzhi, and it was believed that women born in this year would have a fiery temperament, which was thought to shorten their husbands' lives. As a result, many people avoided giving birth during that year.
Nayumi
I do believe in astrology and things like that, but I didn't know about the 'hinoeuma' year.