TABLE OF CONTENTS
・Straight line
・Conic section
・Parabola
・Ellipse
・Hyperbola
Kaya
Starting from this time, I’ll introduce specific examples of functions of one variable over three parts.
This time, we’ll look at straight lines and conic section—starting with straight lines.
Straight line
\[ \text{Straight line}\]
\[ y = ax + b \quad (a, b \text{ are constants})\]
Straight line is also called a linear function.
The graph of \( y = ax \ (a > 0) \) looks like the one shown below.
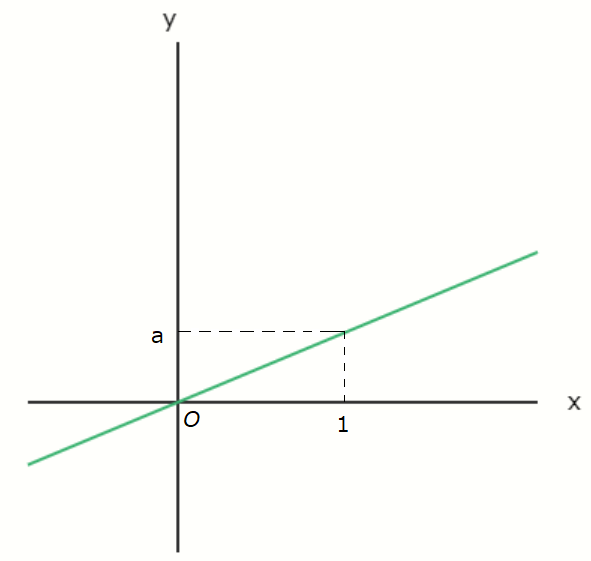
This graph represents a proportional relationship and passes through the origin.
The slope is \( a \), meaning that when you move 1 unit in the \( x \)-direction, you move \( a \) units in
the \( y \)-direction.
Since \( a > 0 \), the graph is a straight line slanting upward to the right.
On the other hand, the graph of \( y = ax \ (a \lt 0) \) looks like the following.
On the other hand, the graph of \( y = ax \ (a \lt 0) \) looks like the following.
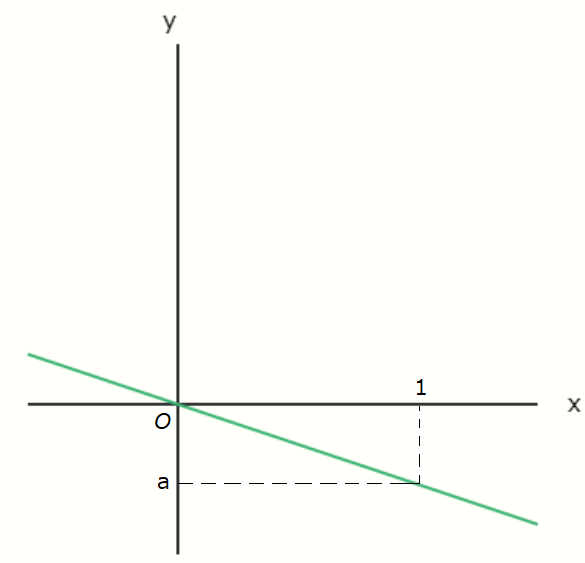
Since \( a \lt 0 \), the graph is a straight line slanting downward to the right.
When \( a = 0 \), the equation becomes \( y = 0 \times x = 0 \), so regardless of the value of \( x \), \( y \) is always 0. This represents the \( x \)-axis.
Next, let’s take a look at the graph of \( y = ax + b \ (a \gt 0) \).
When \( a = 0 \), the equation becomes \( y = 0 \times x = 0 \), so regardless of the value of \( x \), \( y \) is always 0. This represents the \( x \)-axis.
Next, let’s take a look at the graph of \( y = ax + b \ (a \gt 0) \).
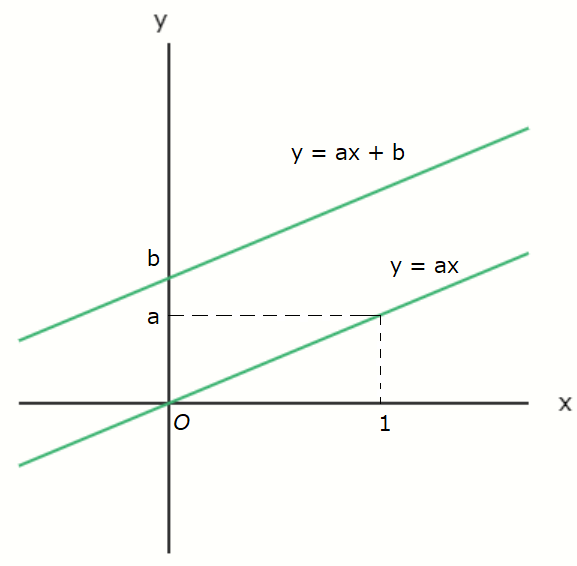
The graph of \( y = ax + b \) is a vertical translation of the graph of \( y = ax \ (a \gt 0) \) by \( b \)
units in the \( y \)-direction.
The value \( b \) is called the \( \boldsymbol{y} \)-intercept.
Conic section
The curves of the second order are curves expressed by quadratic equations in terms of \( x \) and
\( y \).
They are also called conic sections because they can be obtained as the cross-sections of a cone.
Conic sections are broadly categorized into three types: parabolas, ellipses, and
hyperbolas.
Here, we will introduce only the simplest form of the equations for each of these curves.
Parabola
A parabola, when limited to those with the vertex at the origin, can be represented by the following
equation.
\[ \text{Parabora}\]
\[ y = a x^2 \ \ (a \neq 0) \]
Just to clarify in advance, \( x^2 = x \times x \).
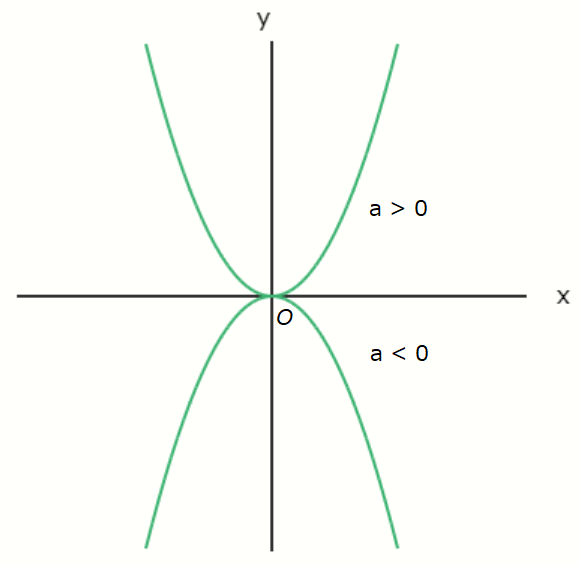
When \( a \gt 0 \), the parabola is said to be concave upward, and in this case, the vertex
gives the minimum value of the parabola.
On the other hand, when \( a \lt 0 \), the parabola is concave downward, and the vertex gives the
maximum value of the parabola.
Ellipse
If the center of an ellipse is at the origin, its equation is given by the following equation.
\[ \text{Ellipse}\]
\[ \frac{x^2}{a^2} + \frac{y^2}{b^2} = 1 \ \ (a \gt 0,b \gt 0 ) \]
As it stands, the equation of an ellipse isn’t a function.
However, if we rearrange it as follows, we can actually view it as a function.
\[ \begin{align}
\frac{x^2}{a^2} + \frac{y^2}{b^2} &= 1 \\\\
\frac{y^2}{b^2} &= 1 - \frac{x^2}{a^2} \\\\
y^2 &= b^2 \left( 1 - \frac{x^2}{a^2} \right) \\\\
y &= \pm \ b \sqrt{1 - \frac{x^2}{a^2}}
\end{align}\]
When \( a \gt b \), the graph of the ellipse looks like the one shown below.
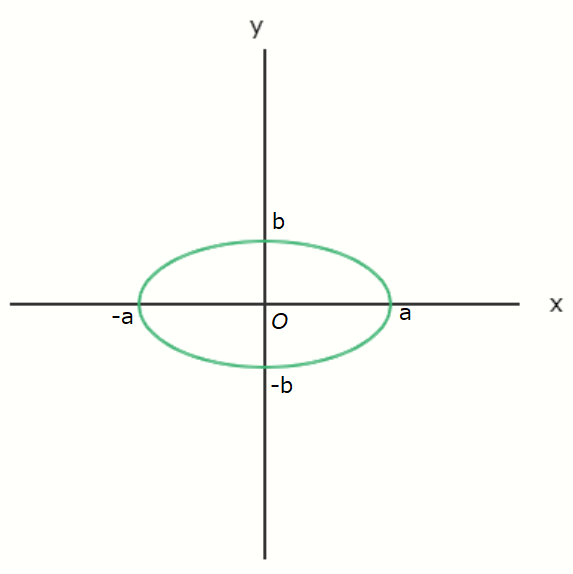
When \( a \gt b \), the ellipse is horizontally elongated.
When \( a \lt b \), it becomes vertically elongated.
If \( a = b \), the ellipse becomes a circle with radius \( a \).
Hyperbola
\[ \text{Hyperbola}\]
\[ \frac{x^2}{a^2} - \frac{y^2}{b^2} = 1 \ \ (a \gt 0,b \gt 0 ) \]
The equation of a hyperbola is obtained by changing the second term of the ellipse's equation to a minus
sign.
Like the ellipse, this equation does not represent a function in its original form.
However, it can be rewritten to be viewed as a function.
\[ \begin{align}
\frac{x^2}{a^2} - \frac{y^2}{b^2} &= 1 \\\\
- \frac{y^2}{b^2} &= 1 - \frac{x^2}{a^2} \\\\
y^2 &= b^2 \left( -1 + \frac{x^2}{a^2} \right) \\\\
y &= \pm \ b \sqrt{-1 + \frac{x^2}{a^2}}
\end{align}\]
Kaya
Here's what the graph looks like.
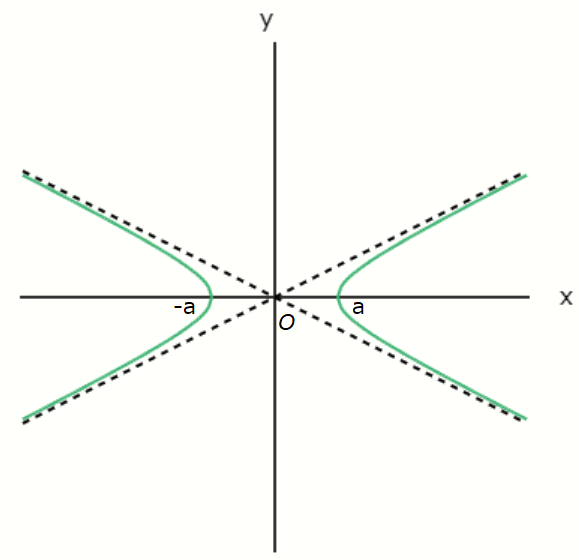
The green line is the graph of the hyperbola.
The black dashed lines are called asymptotes—straight lines that the hyperbola gradually approaches
but never touches.
The asymptotes are given by:
\[ y = \pm \frac{b}{a}x\]
Also, the \( x \)-intercepts of the hyperbola are \( a \) and \( -a \).
Nayumi
The hyperbola has a shape that's kind of like a potter's wheel.
Kaya
That's right. It has a shape like a potter's wheel, with the sides curving inward. Actually, there’s
also a hyperbola where the top and bottom curve inward.
\[ \frac{x^2}{a^2} - \frac{y^2}{b^2} = -1 \ \ (a \gt 0,b \gt 0 ) \]
Nayumi
The right side is \( -1 \).
Kaya
That's right. And the graph looks like this.
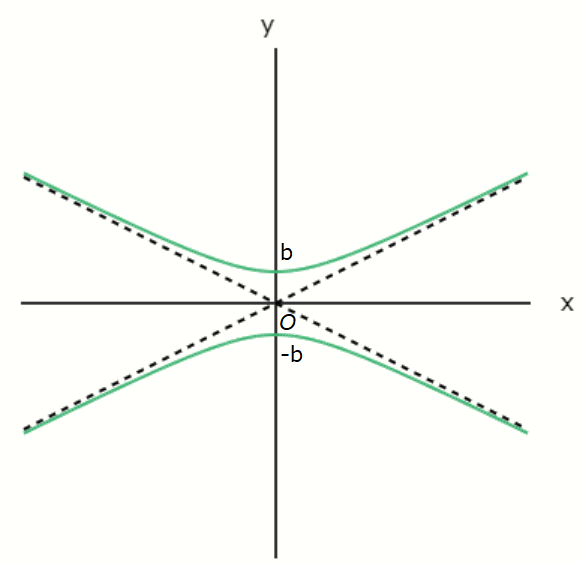
In this graph, where the potter's wheel is laid horizontally, the \( y \)-intercepts are \( b \) and \( -b
\).
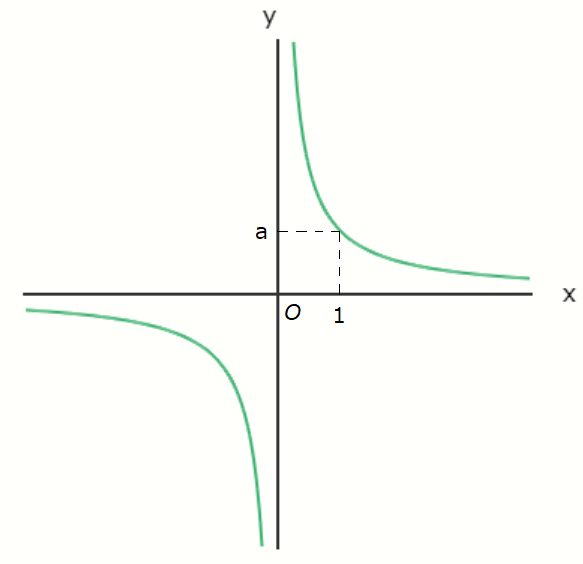
Another well-known equation for a hyperbola is the inverse proportion equation.
Another well-known equation for a hyperbola is the inverse proportion equation.
\[ \text{Inverse proportion}\]
\[ y = \frac{a}{x} \ \ ( a \neq 0 ) \]
This may be a bit difficult, so I won't explain it in detail here, but the equation of inverse
proportionality is actually a rotated version of the hyperbola equation:
\[ \frac{x^2}{\left( \sqrt{2a} \right) ^2} - \frac{y^2}{\left( \sqrt{2a} \right) ^2} = 1 \]
When you rotate the graph of the inverse proportionality by \( 45 ^{\circ} \), it looks like a hyperbola.
Imagine tilting your head by \( 45 ^{\circ} \) and you’ll see that the graph of the inverse proportionality
resembles a hyperbola.
Nayumi
Since we've gone through parabolas, ellipses, and hyperbolas, does that mean we're done with conic
sections?
Kaya
Yeah, let's call it a day for now.
Nayumi
Great work today!
References:
[1] James R. Newman, THE UNIVERSAL ENCYCLOPEDIA OF MATHEMATICS, George Allen & Unwin Ltd, 1964
[2] 石村園子, やさしく学べる微分積分, 共立出版, December 25, 1999
Previous
Ep. 2
Function of one variable
Function of one variable
Next
Ep. 4
Trigonometric function
Trigonometric function